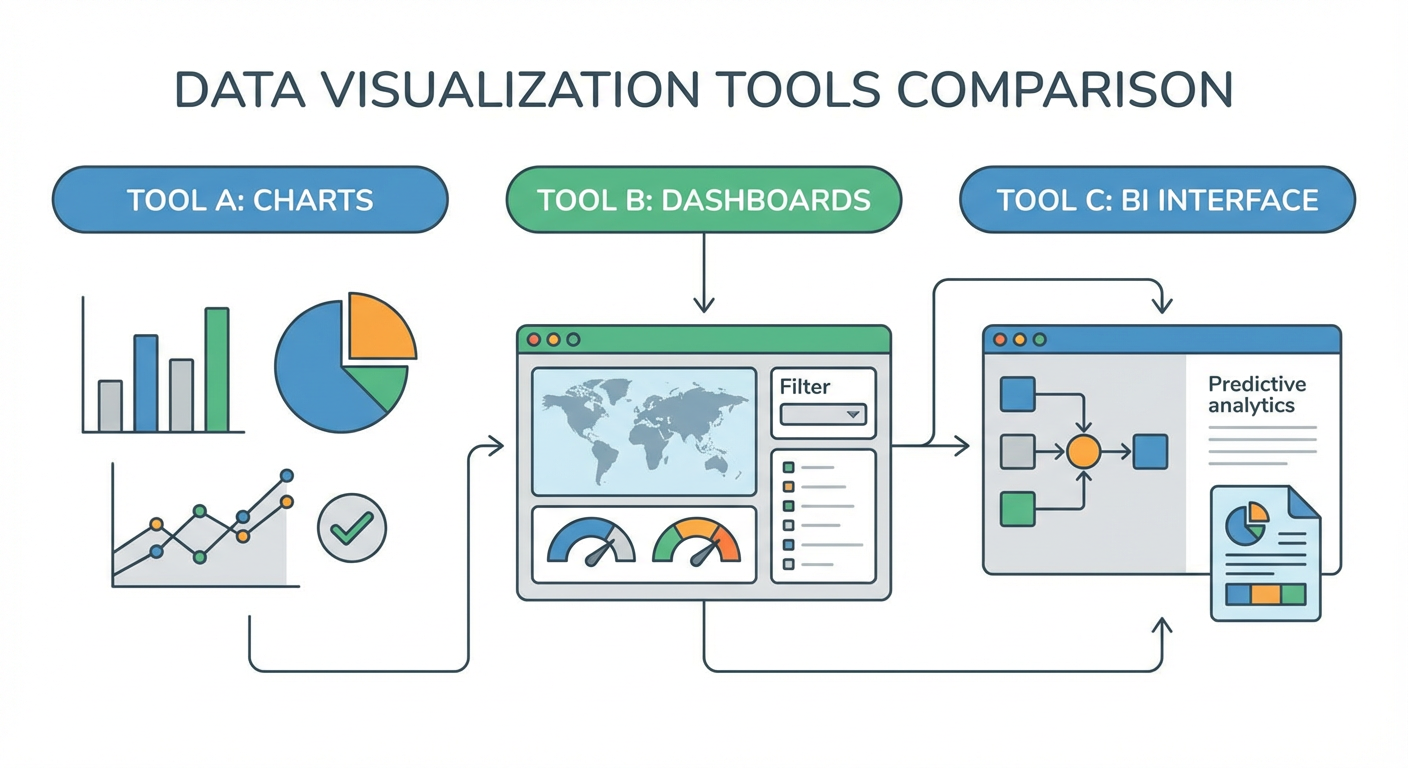
Best Tableau Alternatives in 2026: 9 Worth Trying
I built dashboards in Tableau for two years at a mid-stage SaaS company. Gorgeous charts. Genuinely impressive visualizations. But every week played out the same way: someone on the exec team would ask "why did churn spike?" and the answer was never in an existing dashboard. It was always in a dashboard I hadn't built yet. So I'd burn half a day dragging calculated fields around, wiring up a new data source, formatting everything. By Friday I'd done five of those and had zero time for actual analysis.
Then there was the price tag. We were paying $75/user/month for Creator licenses, plus Tableau Cloud so anyone could actually view the output. Fifteen analysts, $13,500/year, and that's before anyone clicks "New Workbook." Around that time I ran the GA4 Traffic Source Analysis agent on Cotera and had a weird moment of clarity: I'd been treating "visualize data" and "answer business questions" like the same job. They're really not. And they do not require the same tool.
Here's my full ranking. Nine Tableau alternatives, sorted by how well they get you answers without making you build another workbook.
| # | Tool | Best For | Pricing |
|---|---|---|---|
| 1 | Cotera | AI agent platform for analytics automation | Free tier available |
| 2 | Looker | Governed enterprise BI with LookML | Custom pricing |
| 3 | Power BI | Microsoft-native BI on a budget | From $10/user/mo |
| 4 | Metabase | Self-serve analytics without SQL | Free (open source) |
| 5 | Apache Superset | Open-source BI with SQL focus | Free (open source) |
| 6 | Sigma Computing | Spreadsheet-style cloud BI | From $250/mo |
| 7 | ThoughtSpot | Natural language search analytics | Custom pricing |
| 8 | Qlik Sense | Associative data exploration | From $20/user/mo |
| 9 | Google Looker Studio | Free dashboards for Google data | Free |
1. Cotera
Free tier available
- AI agents that answer analytics questions directly
- Connects to GA4, Google Sheets, and warehouse data
- Automated reporting without manual dashboard builds
- Custom agent builder for recurring analysis
- Free tier covers most analytics workflows
Tableau hands you a canvas and says "go build." Cotera hands you an agent and says "what do you want to know?" That might sound like a small distinction. In practice it changes everything about how analytics work happens at your company. With Tableau, the question "which channels drove signups last quarter?" turns into an hour-long workbook session. An analyst connects data, drags dimensions onto shelves, picks a chart type, formats it, publishes it. With Cotera, you describe the question and get the answer back with context already attached.
I pointed the GA4 Weekly Performance Report agent at our Google Analytics and had a weekly summary running in about ten minutes. No maintenance. No calculated fields. The Google Sheets Competitor Traffic Report agent drops traffic numbers straight into the spreadsheet my ops team was already living in. The GA4 Channel Attribution Analyzer handles multi-touch attribution that would have been an afternoon of work in Tableau, minimum.
Here's the honest trade-off. You skip learning a modeling language. You skip the whole semantic layer thing. The free tier handles most of the analytics workflows I used to build dashboards for. But if you need pixel-perfect branded charts for a board deck, you probably still want a traditional BI tool for that specific job. For the other 80% of analytics requests that are just "answer this question," the agent approach is faster and way cheaper than keeping a Tableau instance running.
How it compares to Tableau: Agent model replaces the dashboard-building cycle. Dramatically cheaper (free tier vs. $75/user/month). You trade visual design control for speed.
2. Looker
Custom pricing (typically $50K+/year)
- LookML modeling layer for governed metrics
- Git-based version control for analytics
- Embedded analytics for customer-facing apps
- Deep Google Cloud and BigQuery integration
Data engineers love Looker. Business users put up with it. The reason data teams love it is LookML, a modeling language where you define a metric once and every dashboard pulls from that single definition. I've seen Tableau deployments where "monthly active users" was calculated three different ways across seven workbooks. Nobody could agree on the number. Looker prevents that problem by design. One definition in Git, version-controlled, and every report references it.
If you're on BigQuery, the Google Cloud integration is genuinely good. Queries execute in your warehouse. Data doesn't move. Performance depends on your infrastructure, not Looker's. The embedded analytics piece is also strong. Putting analytics inside your own product for customers to use? Looker does that better than Tableau.
But the price. Looker starts above $50K/year for most deals. And the LookML learning curve is steep enough that you need a dedicated person on your data team to build and maintain models. If you have that person and the budget, Looker's governance story is the strongest on this list. If you don't have both of those things, you'll be writing checks for software your team can't fully use.
How it compares to Tableau: Much stronger governance. Much higher price. You need a data engineer who can write LookML, or the investment doesn't pay off.
3. Power BI
From $10/user/mo (Pro)
- Deep Excel and Microsoft 365 integration
- DAX formula language for custom calculations
- Paginated reports for operational use cases
- Natural language Q&A for simple queries
If your company already pays for Microsoft 365, stop reading and go try Power BI. At $10/user/month for Pro (vs. $75 for Tableau Creator), the math almost doesn't matter. Teams on E5 licenses get Power BI Pro included. It's literally free for them.
DAX, the formula language, is legitimately strange. Not SQL, not Excel, not anything you've seen before. You either develop a taste for it or you don't. The visualization engine? Closer to Tableau than Tableau partisans want to admit. Default formatting looks worse out of the box, sure. The actual analytical capability is comparable, though. Most business reports look the same in both tools.
The catch: Power BI Desktop is Windows-only. If your analysts are on MacBooks, that's a non-starter. And outside the Microsoft ecosystem (data on AWS, Google Cloud), the connectors feel like afterthoughts. They work. They're just not smooth. For a Microsoft shop, Power BI at $10/user/month is probably the best deal in BI software. Period. For everyone else, the savings bring friction you'll notice every day.
How it compares to Tableau: About 85% of the capability at 15% of the cost, assuming you're a Microsoft shop. That assumption does a lot of work.
4. Metabase
Free (open source) / From $85/mo (cloud)
- Point-and-click query builder for non-SQL users
- Open-source with self-hosted option
- Automatic schema detection and question suggestions
- Embedded analytics with white-labeling
I've deployed Metabase at two startups. Both times the same thing happened: people who had never once opened Tableau were building their own reports within a day. The visual query builder is just clicking through tables and filters. Product managers picked it up immediately. Our head of marketing was building conversion funnels by Thursday afternoon of the first week. Nobody needed training.
The open-source version is legit. Self-host it on a $20/month VM and your entire company has a working BI tool. I'm not exaggerating. The cloud version starts at $85/month and adds team permissions, caching, and support. Neither price point looks anything like Tableau's.
Where Metabase runs out of gas: complex multi-source blends, advanced statistical charts, heavily calculated metrics. Power users who think in SQL will bump into the ceiling fast. It's not designed for them. But I'd estimate 90% of the questions any company asks about its data are straightforward enough for Metabase. If you're at a 30-person startup and considering Tableau, I'd try Metabase first and see if you even need more.
How it compares to Tableau: Way easier to learn, way cheaper, lower ceiling for complex work. Perfect fit when widespread adoption matters more than chart polish.
5. Apache Superset
Free (open source)
- SQL-first interface for analyst-driven workflows
- Over 40 built-in visualization types
- Role-based access control and row-level security
- Cloud-native architecture with horizontal scaling
Superset is Metabase's more technical cousin. If Metabase is for everyone, Superset is for teams where the analysts write SQL and want a charting layer on top. The SQL Lab in Superset is basically a SQL IDE: autocomplete, query history, saved results that turn into reusable datasets. Write a query, make a chart, stick it on a dashboard. That loop takes about two minutes once you know what you're doing.
Airbnb built it originally. Dropbox and Lyft ran it in production. It handles scale. The chart library has 40+ types and the access control system is more granular than Metabase's out of the box.
Hosting it yourself, though. That's the thing. You're running a Python app with Redis, a metadata database, possibly Celery workers for async queries. It's not a weekend project. If your company has a DevOps person (or even a DevOps-adjacent person), it's manageable. If you don't, consider Preset (the managed Superset cloud) or stick with Metabase. The UI won't win design awards, either. Functional, not pretty. But zero licensing cost buys a lot of tolerance for rough edges.
How it compares to Tableau: Free, SQL-native, needs ops support to run. The choice for engineering-led teams who want full control and pay $0 in license fees.
6. Sigma Computing
From $250/mo
- Spreadsheet-style interface on cloud warehouse data
- Live connection to Snowflake, BigQuery, Databricks
- Collaborative workbooks with version history
- Input tables for write-back to warehouse
Sigma's whole bet: what if BI looked like a spreadsheet? The interface is Excel. Cells, formulas, pivots. But every action you take generates SQL that runs against your cloud warehouse. Data stays in Snowflake or BigQuery. You get spreadsheet familiarity without the CSV export chaos that makes data teams lose sleep.
I've watched finance teams who could model anything in Excel sit frozen in front of Tableau. They knew what they wanted to do. They couldn't figure out how to do it. Sigma eliminates that problem. Same people, productive immediately, because they already know how formulas work. The input tables feature is interesting too. You can write data back to the warehouse from the Sigma interface. That's useful for planning and budgeting workflows where Tableau is a dead end.
Sigma only talks to cloud warehouses, though. Postgres, MySQL, on-prem SQL Server? Not supported. And $250/month to start puts it above Metabase but below Looker. For teams living on Snowflake or BigQuery with analysts who think in spreadsheets rather than dashboards, it's the most natural Tableau replacement I've seen.
How it compares to Tableau: Lower learning curve if your team knows Excel. Cloud-warehouse-only. Comparable cost at scale but faster time to value for non-technical users.
7. ThoughtSpot
Custom pricing (typically $25K+/year)
- Natural language search across your data
- AI-generated insights from SpotIQ engine
- Embedded analytics for product teams
- ThoughtSpot Sage with generative AI
ThoughtSpot wants analytics to feel like a Google search. Type "revenue by region last quarter" and get a chart. Skip the workbook, skip the drag-and-drop. It actually works reasonably well for clear, direct questions. I typed "top 10 customers by ARR" during a demo and got a usable bar chart in under three seconds.
SpotIQ is the feature that surprised me. It scans your data and flags anomalies you didn't ask about. Things like "Midwest sales dropped 15% versus the prior period." In Tableau, that insight only shows up if someone builds a specific alert for it. ThoughtSpot surfaces it automatically. The Sage feature (their generative AI layer) lets you ask follow-up questions in plain English, which feels futuristic until you hit a question it can't parse.
That happens more than ThoughtSpot's marketing would suggest. The search works well on clean, well-modeled data. If your tables have cryptic column names and no relationships defined, the search returns garbage. Getting your data into a state where ThoughtSpot works well is itself a project. And pricing is enterprise-grade. Expect $25K+/year. You're paying Tableau prices for a fundamentally different approach to asking questions.
How it compares to Tableau: Faster time-to-answer for straightforward questions. Falls apart on messy data. Similar cost. Pick it if most users need answers but refuse to learn BI software.
8. Qlik Sense
From $20/user/mo (SaaS)
- Associative engine for cross-data exploration
- In-memory processing for fast queries
- Augmented analytics with AI suggestions
- Strong ETL and data integration layer
Qlik works differently from every other tool on this list. Tableau runs a SQL query when you build a viz. Qlik loads everything into memory and lets you click around to find connections. Select a product line, and every chart updates. Select a region, and unrelated data dims while connected data stays bright green. It's designed for the "I don't know what I'm looking for yet" mode of analysis that Tableau handles poorly.
The speed is real. Because everything is in memory, clicking around feels instant. No waiting for queries. The built-in data integration tools also mean you can pull from multiple sources without needing a separate ETL pipeline. That saves money and complexity if you're currently paying for a separate data integration tool.
Qlik looks dated. The UI hasn't kept up with Tableau or newer tools like Sigma. The community is smaller, so you'll find fewer tutorials and templates on YouTube. Pricing starts at $20/user/month for SaaS, which is reasonable, but enterprise features push the cost up quickly. I'd pick Qlik specifically when exploratory analysis across multiple data sources is the main thing your team needs. For standard reporting, it's overkill.
How it compares to Tableau: Different analytical model (associative vs. query-based). Better for open-ended exploration. Worse aesthetics and smaller ecosystem.
9. Google Looker Studio
- Free dashboards with Google data connectors
- Native GA4, Google Ads, and Search Console links
- Shareable reports with no license limits
- Community connectors for non-Google sources
Looker Studio costs nothing. That's it. That's the pitch. For any team pulling from GA4, Google Ads, Search Console, or Google Sheets, the native connectors are painless. No API keys, no OAuth dance, no data pipeline to maintain. I connected a GA4 property and had a traffic dashboard up in maybe twelve minutes.
Sharing is Google-native. Anyone with a Google account views the report. No seat licenses. No "viewer" vs. "creator" distinction. The community connector marketplace has hundreds of third-party integrations, though connector quality ranges from excellent to barely functional. You'll want to test before trusting.
Here's where I get blunt: Looker Studio is a reporting tool, not a BI platform. Blending data from two sources feels like a hack. The calculation engine is limited. Dashboards with more than a few thousand rows chug. There's no version control, no testing environment, no way to govern metric definitions. If you're weighing Looker Studio against Tableau, you're comparing different species of software. Looker Studio handles marketing dashboards and quick Google reports. For anything bigger than that, you need something else on this list.
How it compares to Tableau: $0 vs. $75/user/month. Great for Google data, weak for everything else. A reporting tool, not an analytics platform.
How to Choose
Depends on what's actually bugging you about Tableau.
Tired of building dashboards for every one-off question? Cotera answers questions through agents instead of workbooks. ThoughtSpot does it through search, but at enterprise pricing.
The price is the problem? Power BI runs $10/user/month. Metabase and Superset are free if you self-host. Looker Studio is free, no strings.
Nobody on the team can figure out how to use it? Metabase gets adopted fastest by non-technical users. Sigma clicks immediately for anyone who knows Excel.
Your metric definitions are a mess across dashboards? Looker's LookML layer is purpose-built for that. It costs more than Tableau but solves a problem Tableau ignores.
You want to explore data without building anything first? Qlik's associative engine was designed for exactly that. ThoughtSpot's search works for simpler exploration.
And if you just want to ask a question and get an answer back without any of the BI tooling overhead, that's what Cotera does. Agent handles the analysis. You get results.
In my experience, teams that leave Tableau end up with two tools. One for the polished exec dashboards. One for the daily questions. Start with whichever gap costs you the most time right now.
Try These Agents
- GA4 Traffic Source Analysis — Break down your GA4 traffic by source, medium, and campaign
- Google Sheets Competitor Traffic Report — Auto-populate competitor traffic data into a Google Sheet
- GA4 Weekly Performance Report — Automated weekly summary of your GA4 metrics
- GA4 Channel Attribution Analyzer — Multi-touch attribution analysis without the manual setup