How to Build a Competitor Pricing Dashboard (The Simple Way)
I was asked to build a competitor pricing dashboard three times at three different companies. The first time, I used Tableau. Beautiful waterfall charts, interactive filters, drill-down capabilities. Nobody used it because nobody had Tableau on their laptop. The second time, I used Notion. Pretty layout, nice visual structure. It got stale after month two because updating Notion databases is tedious and nobody volunteered.
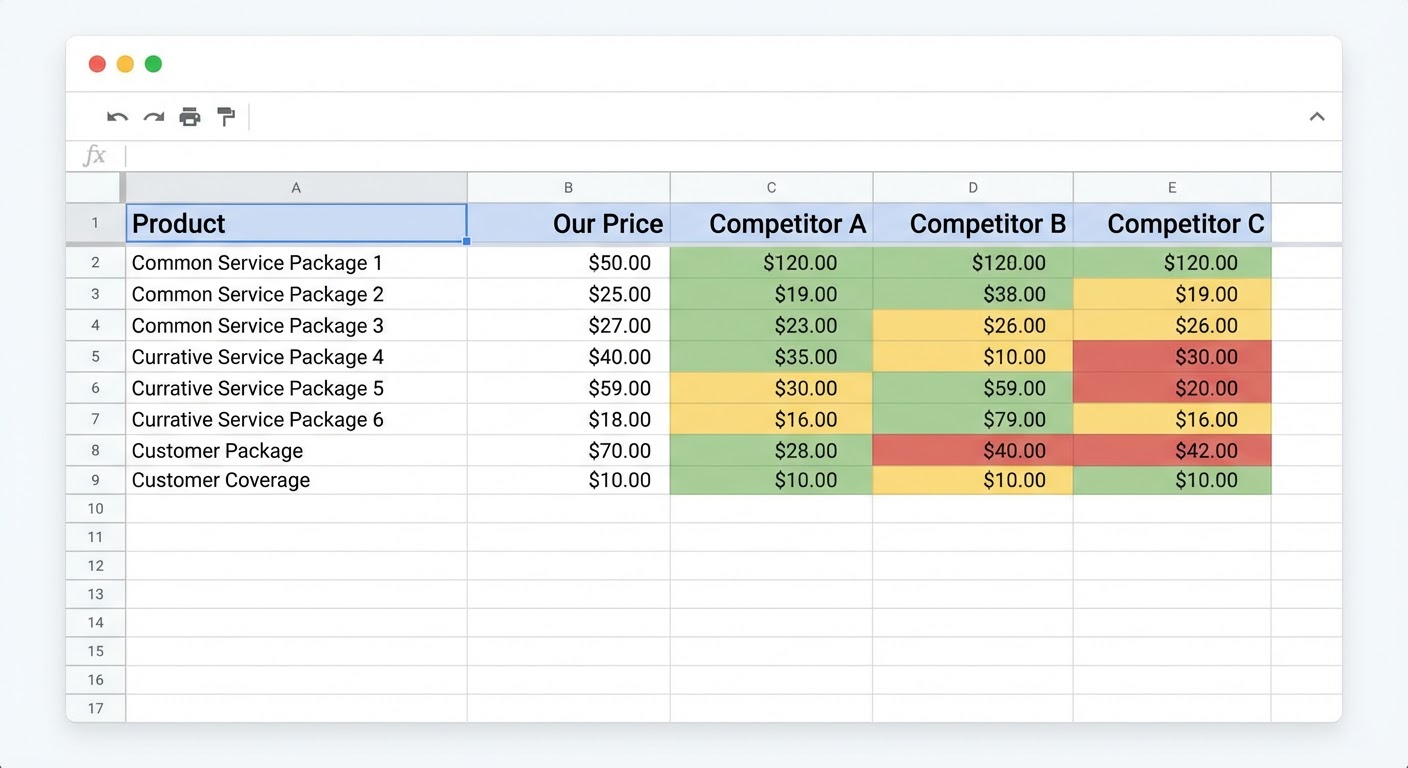
The third time, I used Google Sheets. Ugly. Basic. Functional. The entire sales team checks it before competitive calls because it's a link in their browser bookmarks and it loads in two seconds. Fancy dashboards die. Google Sheets live forever.
The Five Columns You Need
Column A: Competitor name. Column B: Lowest tier price. Column C: Most popular tier price. Column D: Highest tier price. Column E: Last changed date. That's the dashboard. Five columns.
I can already hear objections. "What about per-user pricing versus flat rate?" "What about annual versus monthly?" "What about usage-based components?" Fine. Add those as notes in a Column F called "Model Notes." Keep it to one line per competitor. Something like "Per user, annual only, $X/user/mo billed annually" or "Usage-based above 10K contacts, $0.01/contact." Don't build a separate column for every pricing dimension. You'll end up with a 20-column spreadsheet that nobody can read on a laptop screen.
The five-column approach works because it answers the question every sales rep asks: "roughly how much do they charge?" Not the exact quote a prospect would receive. Not every possible configuration. The ballpark. When a rep is on the phone and a prospect says "we're also looking at Competitor X," the rep glances at the dashboard and knows they're either cheaper, more expensive, or comparable. That's enough to adjust the conversation.
Filling In the Dashboard the First Time
This takes about an hour for five competitors. Visit each pricing page. Write down the three price points. Note the date. Done.
Some competitors don't publish pricing at all. You'll see "Contact Sales" or "Request a Quote" instead of a number. For these, you have two options. One, leave the cell blank and note "Custom pricing, not published." Two, use whatever intelligence you have — prospect feedback from deals, quotes shared during competitive evaluations, Glassdoor salary data extrapolated to per-seat costs (sketchy but directional). I prefer option one for the dashboard and option two in the battlecard, where there's room for nuance.
For competitors with complex pricing models (usage-based, tiered by features, different pricing for different products), pick the most common configuration. What does a 50-person company with typical usage pay per month? That's your number. Don't try to capture every edge case. The dashboard is for quick reference, not financial modeling.
Keeping It Updated (The Make-or-Break Step)
A competitor pricing dashboard that was accurate six months ago is actively harmful. Reps will quote against stale prices and either overshoot ("we're cheaper than them!" when they just dropped 20%) or undersell ("they're cheaper" when the competitor actually raised rates). Stale data is worse than no data because people trust the dashboard.
Monthly updates are the minimum. The first Tuesday of every month, someone opens the dashboard, visits each competitor's pricing page, and updates any changes. If nothing changed, they update the "Last Checked" date so everyone knows the data is fresh. That "Last Checked" column is psychologically important — it tells the team they can trust what they're looking at.
Who does the updating? Rotate it. If one person owns the dashboard, it dies when they leave, get promoted, or go on vacation for two weeks. A rotation of three people (product marketing, competitive intelligence, sales ops) means the dashboard always has someone responsible. Put it on a shared calendar.
Adding Historical Tracking (Optional But Powerful)
After three months of updates, you'll want to know how pricing has trended over time. The simplest approach: create a second tab called "History" and paste a timestamped row every time something changes. Date, competitor, old price, new price, notes on what else changed.
After a year, this history tab tells stories that the current dashboard can't. "Competitor A raised prices twice in 12 months — they're moving upmarket." "Competitor B launched a free tier in Q3 and their paid tiers dropped by 15% — they're going volume." "Competitor C hasn't touched pricing in 18 months — either they've found their sweet spot or they're neglecting the pricing page."
These trends inform your own pricing strategy. If every competitor in your space is raising prices, the market probably supports a price increase from you too. If competitors are cutting prices, there might be margin pressure you should understand before it hits your pipeline.
Why Use an Agent for This
The monthly update is where dashboards die. Not because it's hard — it takes maybe 20 minutes. Because someone has to remember to do it, carve out the time, and actually do the boring work of visiting five websites and comparing prices. Human nature being what it is, month three is when people start forgetting.
The competitor pricing analyzer monitors pricing pages automatically and flags changes. Instead of someone proactively checking every month, the dashboard gets updated when something actually moves. If nothing changed (which is most months), nobody wasted time confirming the obvious.
The Google Sheets competitor traffic report can push data directly into the same spreadsheet where your pricing dashboard lives. Traffic trends alongside pricing data in one sheet. When a competitor drops prices and traffic spikes next month, you see the correlation without switching tools.
For the broader competitive picture, the competitor traffic analysis adds context that pricing alone can't provide. A competitor with growing traffic and stable pricing is doing well. A competitor with shrinking traffic and dropping prices is struggling. That context changes how you sell against them.
The dashboard stays a Google Sheet. Simple, fast, accessible. The agent just handles the update process so the data stays fresh without anyone remembering to check five websites every first Tuesday.
Try These Agents
- Competitor Pricing Analyzer — Automatic pricing page monitoring and change detection
- Google Sheets Competitor Traffic Report — Push competitive data directly into your shared spreadsheet
- Competitor Traffic Analysis — Traffic context alongside pricing for competitive positioning
- G2 Competitive Battlecard Generator — Turn pricing and review data into sales-ready battlecards