How to Build a Competitive Benchmark Report That Gets Used
I built my first competitive benchmark report in 2022. Thirty-eight pages. Color-coded charts. Executive summary. Appendix with methodology notes. I was proud of it. I sent it to the leadership team on a Monday. By Friday I checked the Google Drive view count. Three views. One of them was me.
The report was thorough and it was useless. Nobody read it because nobody had time to read 38 pages about competitors when they had their own deadlines. The sales team wanted one thing: what do I say when a prospect mentions Competitor X? Marketing wanted something else: where should we spend next quarter's budget? My beautiful 38-page document answered neither question directly.
So I tore it up and started over. What I built instead was a two-page competitive benchmark report that our team checks weekly. Here's the structure I landed on and why it works.
The Two-Page Constraint
Impose a hard limit on yourself. Two pages. One for the competitive overview, one for the "so what" — the implications and recommended actions. If you can't fit it in two pages, you're including data nobody asked for.
This constraint forces hard choices about what matters. You can't include every metric from every competitor. You have to pick the 5-7 data points that actually tell you whether you're winning or losing. That selection process is itself valuable because it makes you think about which numbers actually drive decisions.
I've seen teams spend weeks building 30-page competitive reports with beautiful formatting. Those reports get skimmed once and filed away. My ugly two-pager gets pulled up in every pipeline review because people can find what they need in 15 seconds.
Page One: The Competitive Snapshot
The first page should answer one question: where do we stand right now? Not last quarter. Not the trailing twelve months. Right now.
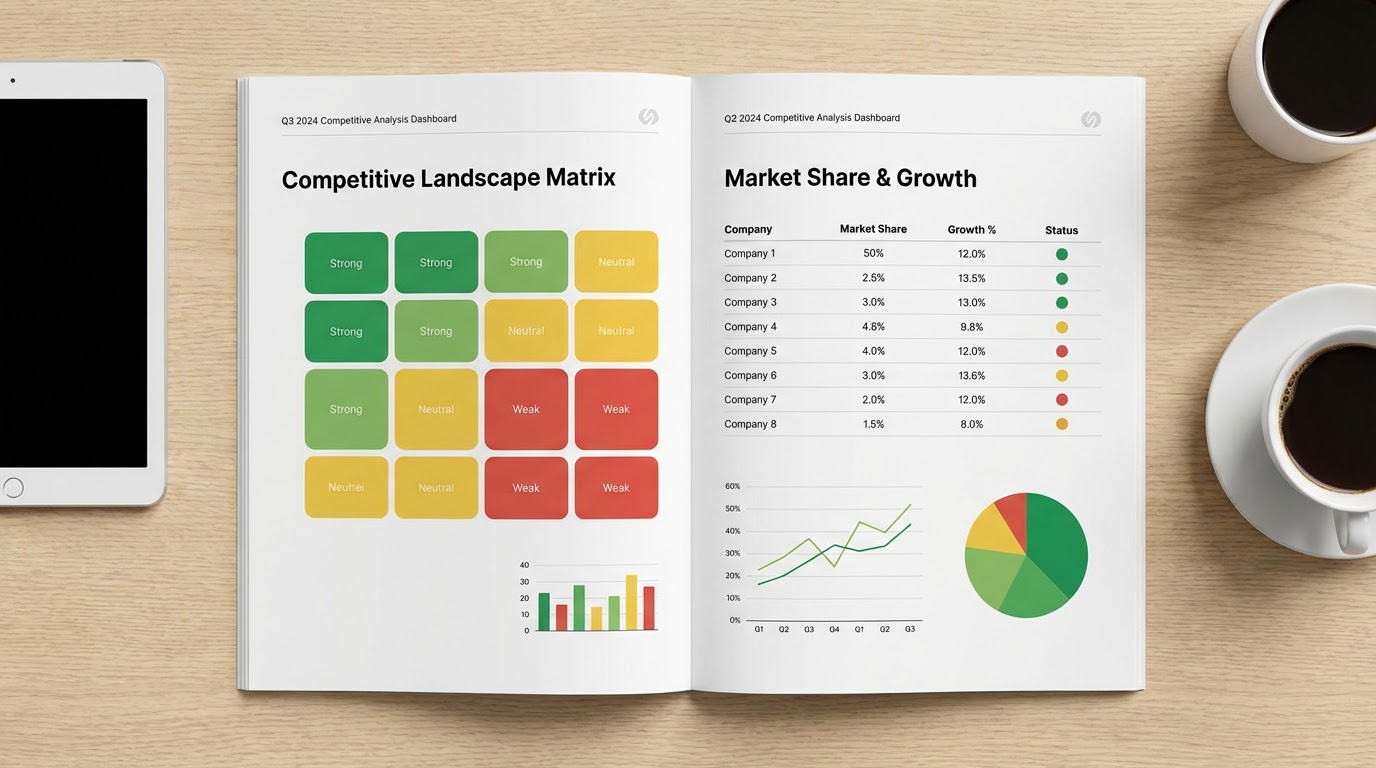
I use a simple grid. Competitors across the top, metrics down the side. The metrics I've found most useful for a competitive benchmark are traffic growth rate, review sentiment on G2, pricing position, feature velocity, and win rate. Five metrics. Each cell gets a color: green (we're ahead), yellow (roughly even), red (we're behind). No detailed numbers on this page. Just the colors and a one-line note explaining each.
The grid tells you at a glance where you're strong and where you're weak. If there's a column of red for one competitor, that's your biggest threat and everyone can see it without reading a paragraph of explanation.
Below the grid, one paragraph of context. What changed since the last report? Did anyone launch something? Did pricing shift? Did a competitor's review sentiment tank? Three to four sentences, tops. If nothing meaningful changed, write "No material changes since last report." That's a perfectly good update. Not every month has drama.
Page Two: The "So What" Page
This is the page that turns your benchmark report from a research artifact into a decision tool. I've seen competitive reports that are all data and no interpretation. Those are Wikipedia entries, not business tools.
Page two has three sections. First: what should sales know? Two to three bullet points about positioning changes, new objections to expect, or talk tracks that need updating. If Competitor B dropped their price by 20%, your reps need to know before they walk into their next deal, not after they lose it.
Second: what should marketing do differently? Maybe a competitor started ranking for keywords you own. Maybe their content strategy shifted. Maybe they're outspending you on paid search in a segment you thought was yours. One to two recommendations with enough context that someone can act on them this week.
Third: what should product be aware of? New features competitors shipped, gaps they closed, gaps they opened. Product teams don't need your competitive opinion. They need the facts so they can form their own. Keep this section clinical.
Where the Data Comes From
People get stuck on this part. They think competitive benchmarking requires expensive tools and complex setups. It doesn't. Most of the data is free or close to it.
Traffic data comes from SimilarWeb's free tier. It's directional, not exact, but exact doesn't matter for benchmarking. You care about trends, not precise visitor counts. Review data comes from G2 and Capterra — just read the reviews. Pricing comes from checking their pricing page (screenshot it every month so you can track changes). Feature velocity comes from reading their changelog or product blog. Win rate comes from your own CRM.
The only thing you're doing with these sources is pulling numbers into your two-page template monthly. First time takes maybe three hours. After that, updates take about an hour because you know where to look and what changed versus what stayed the same.
The Update Cadence That Actually Works
Monthly is the right cadence for most B2B companies. Weekly is overkill unless you're in a market where competitors make moves every few days (adtech, maybe fintech). Quarterly is too infrequent — by the time you notice a trend it's three months old and your competitors have already acted on it.
The report goes out the first Monday of every month. Same day, same format, same Slack channel. Consistency matters more than perfection. A slightly imperfect report that shows up reliably every month builds more trust than a polished masterpiece that appears whenever someone remembers to write it.
I learned this the expensive way. Our first attempt at competitive reporting was "we'll update it when something changes." Guess what? Something always changes and nobody ever updates it. Put it on the calendar. Treat it like a standup — it happens regardless.
Common Mistakes That Kill Benchmark Reports
Tracking too many competitors is the most common one. Pick three to five. Your top two direct competitors, one aspirational competitor (the market leader you want to beat someday), and maybe one disruptor (the startup eating your lunch from below). More than five and the report gets unwieldy, the data gets stale, and nobody can remember who's who.
Another mistake: mixing opinion with data. Keep page one purely factual. "Competitor B's G2 rating dropped from 4.5 to 4.2" is data. "Competitor B is struggling with product quality" is opinion. Put opinions on page two where they belong, clearly labeled as your interpretation.
The worst mistake is making the report a one-person job. If only one person builds it and they leave, get promoted, or just get busy, the report dies. Assign sections. Traffic person pulls traffic. Sales ops pulls win rates. Product marketing reads the changelogs. Distribution of labor keeps the thing alive when individuals get pulled into other work.
Why Use an Agent for This
The biggest killer of competitive benchmark reports isn't the analysis. It's the data collection. Nobody wakes up excited to check five competitors' pricing pages, read through 30 G2 reviews, and pull traffic data from SimilarWeb. That's the part that gets skipped, and when the data collection gets skipped, the whole report dies.
An agent handles the tedious collection layer. The competitor traffic analysis agent pulls traffic trends and channel breakdowns for your competitor list. The Google Sheets competitor traffic report drops that data into a shared spreadsheet so the whole team can access the raw numbers.
For the battlecard and positioning side, the G2 competitive battlecard generator reads through competitor reviews and synthesizes the strengths, weaknesses, and common complaints. That becomes the raw material for your page two recommendations.
You still write the analysis. You still decide what matters and what doesn't. But the three hours of data collection shrinks to about 15 minutes of review. Which means the report actually gets published every month instead of trailing off after month two.
Try These Agents
- Competitor Traffic Analysis — Pull traffic trends and channel mix for your competitor set
- Google Sheets Competitor Traffic Report — Automated competitor data in a shared spreadsheet
- G2 Competitive Battlecard Generator — Synthesize competitor strengths and weaknesses from G2 reviews
- Competitor Pricing Analyzer — Track competitor pricing page changes over time